
Total Waste Recycled
Total Energy Consumed from Renewable Sources
Total Water Consumption
Emissions Avoided
Material Topics
- Energy and Emissions
- Climate change
- Water Stewardship
- Circular Economy and Waste Management
- Biodiversity and Nature Protection
- Responsible Value chain Management
Significant topics raised
- Energy management
- GHG emissions reduction
- Water management
- Waste management
SDGs Impacted


Environment Targets & Progress
Climate Change and Energy Strategy
R&D, Innovation & Product Stewardship
Circular Economy & Waste Management
Water & Pollution Management
Renewable electricity consumption
Net zero product
Waste to landfill
Recycled water usage
Renewable electricity consumption
LCA completed
Waste to landfill
Water Risk Assessment and feasibility study conducted at the Pan-India level. Installation of the Smart water system has been initiated.
On track
On track
On track
On track
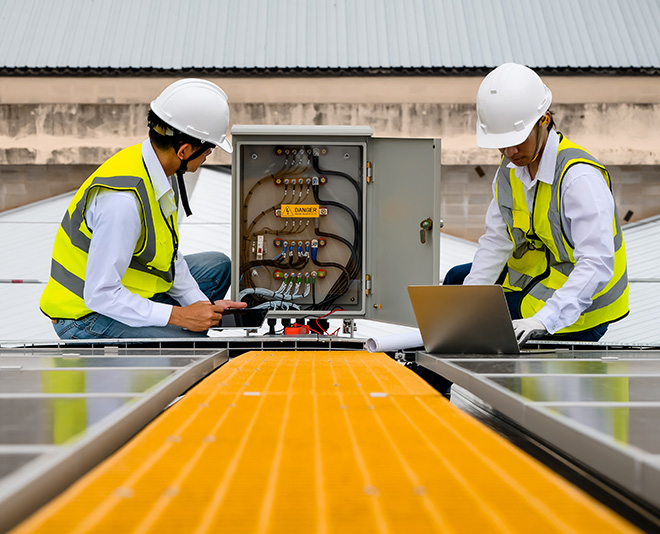
Energy Management
Efficient energy management drives our
operational excellence and mitigates climate
impact. Lean manufacturing practices and
routine audits systematically optimise power
consumption across our facilities. ISO 50001
certifications at key manufacturing sites
guarantee a structured approach to energy
efficiency. Smart control systems monitor
real-time usage to identify and eliminate
operational waste instantly. Upgraded
power panels enhance electrical quality
and reduce harmonic distortion. A growing
reliance on renewable energy further
anchors our long-term sustainability. Please
refer to our Sustainability Report for more
information on our energy management
initiatives.
| Energy Source | FY 2025-26 | FY 2024-25 | YoY Change (%) |
|---|---|---|---|
| Electricity – Non-renewable | 8,60,407 | 7,68,124 | 12.0 |
| Electricity – Renewable | 1,93,461 | 1,57,554 | 22.8 |
| Fuel - Non-Renewable | 5,54,784 | 5,05,084 | 9.8 |
| Total Energy Consumption | 16,08,652 | 14,30,762 | 12.4 |
| Metric | FY 2025-26 | FY 2024-25 |
|---|---|---|
| Energy intensity (GJ per ` crore turnover) | 57.0 | 65.2 |
| % electricity from renewable sources | 18.3 | 17.0 |
GHG Emissions
Decisive actions reduce our greenhouse gas emissions and accelerate our transition to a
low-carbon future. We are increasing our adoption of renewable power to meet a growing
share of our electricity needs. Installing new rooftop solar panels at key manufacturing sites
strengthens our clean energy infrastructure. Through bilateral green energy agreements and
wind-solar hybrid projects, we are significantly reducing our overall carbon footprint. Please
refer to our upcoming Sustainability Report for more details on our greenhouse gas emission
reduction initiatives.
| Emission Type | FY 2025-26 | FY 2024-25 | YoY Change (%) |
|---|---|---|---|
| Scope 1 (MTCO2e) | 31,710 | 29,061 | 9.1 |
| Scope 2 (MTCO2e) | 169,691 | 155,118 | 9.4 |
| Total Scope 1 and Scope 2 emission Intensity (MTCO2e/Crore INR) | 7.1 | 8.4 | (15) |
| Scope 3 (MTCO2e) | 83,08,150 | 53,52,123 | 55.2 |
| Scope 3 emission Intensity (MTCO2e/Crore INR) | 294.7 | 296.5 | (0.6) |
Note: GHG emissions have been quantified across 9 of the 15 Scope 3 categories defined under the GHG Protocol (Categories 1, 2, 3, 4, 5, 6, 7, 9, and 15), an increase from 7 categories reported in FY‑2024‑25. Category 1 emissions, covering purchased goods, constitute the most significant share.
Breakdown of Scope 1 Emissions
| Source (MTCO2e) | FY 2025-26 | FY 2024-25 |
|---|---|---|
| Diesel; Petrol; CNG | 2,751 | 2,500.8 |
| LPG | 155.9 | 163.3 |
| LSHS | 3349 | 8,472.9 |
| PNG | 25,159.5 | 17,924.1 |
| Fugitives | 294.6 | 0.02 |
| Total Scope 1 | 31,710 | 29,061 |
Air Emissions
| Pollutant | FY 2025–26 (Tonnes) | FY 2024–25 (PPM)* |
|---|---|---|
| NOx | 23.4 | 23.4 |
| SOx | 30.6 | 27.0 |
| PM | 32.5 | 68.4 mg/m³ |
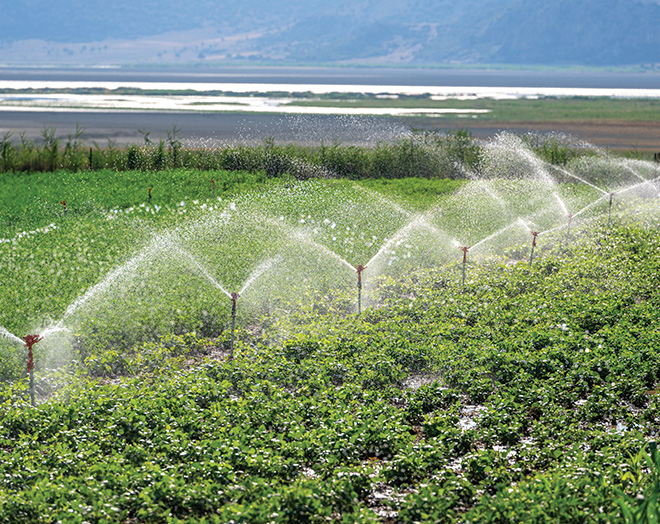
Water Management
Our innovative methods significantly reduce our overall water consumption. We ensure that
efficient technologies seamlessly integrate into our manufacturing processes to lower daily
usage. Upgraded effluent and sewage treatment plants use advanced filtration to maximise
recycling rates. We implement a strict Zero Liquid Discharge system to guarantee total
water reuse and prevent any external environmental discharge. Our smart irrigation systems
adjust output based on real-time weather and soil moisture data to conserve water across
landscaped areas. We rigorously adhere to pollution control guidelines to ensure full regulatory
compliance. Please refer to our Sustainability Report for more information on our water
management initiatives.
Water Withdrawal (KL)
| Source | FY 2025-26 | FY 2024-25 | YoY Change (%) |
|---|---|---|---|
| Groundwater | 370,080 | 252,829 | 46.3 |
| Third-party water | 33,089 | 13,995 | 136 |
| Others | 16,884 | 29,344 | (42.4) |
| Total Withdrawal | 420,053 | 296,168 | 41.8 |
Water Consumption and Intensity
| Pollutant | FY 2025–26 (KL) | FY 2024–25 (KL) |
|---|---|---|
| Total Water Consumed (KL) | 407,443 | 280,808 |
| Water intensity (KL / ` crore turnover) | 14.4 | 12.8 |
Waste Management and Circularity
We approach waste management as a critical pillar of our sustainability strategy, guided by
a structured hierarchy that enables our transition from a linear to a circular operating model.
Our flagship products are engineered for longevity, and we maximise resource recovery across
our manufacturing processes. In FY 2025-26, we recycled or recovered 62.8% of our total waste
and achieved 100% of our Extended Producer Responsibility (EPR) targets for plastic, e-waste,
and battery waste. Through deliberate efforts in strengthening waste recovery, we have also
reduced landfill disposal by 54.8% compared to FY 2024-25, taking a meaningful step towards
our target of Zero Waste to Landfill by 2030. For more details on our waste management
initiatives and circular economy practices, please refer to our upcoming Sustainability Report.
Waste Generated by Type (MT)
| Waste Type | FY 2025-26 | FY 2024-25 |
|---|---|---|
| Plastic Waste | 5,873 | 4,654 |
| E-Waste | 406 | 377 |
| Battery Waste | 23 | 9 |
| Biomedical waste | 0.04 | 0.02 |
| Other Hazardous Waste | 7,760 | 6,081 |
| Other Non-Hazardous Waste | 16,761 | 13,884 |
| Total Waste Generated | 30,823 | 25,005 |
Waste Recycled / Recovered (MT)
| Category | FY 2025-26 | FY 2024-25 |
|---|---|---|
| Recycled | 18,357 | 19,214 |
| Reused | 0 | 0 |
| Other recovery operations | 994 | 6 |
| Total Waste Recovered | 19,351 | 19,220 |
Waste Disposed (MT)
| Disposal Method | FY 2025–26 | FY 2024–25 |
|---|---|---|
| Landfilled | 340 | 752 |
| Incinerated | 89 | 103 |
| Other disposal operations | 11,043 | 4,930 |