

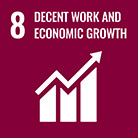
Domestic and global conferences
attended in FY 2025-26
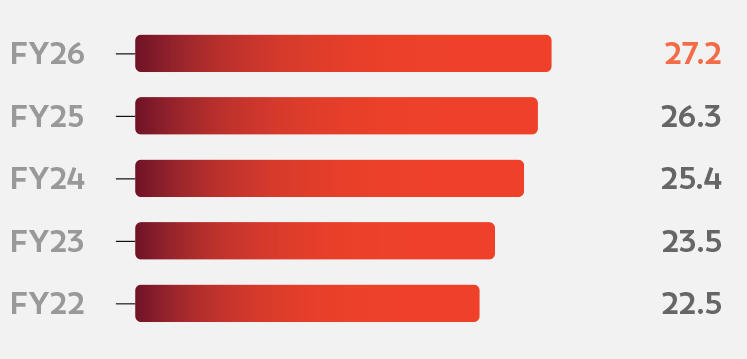
International investor geographies
covered via NDRs in FY 2025-26
Dividend Payout Ratio

Increase in analyst coverage, taking total
coverage to 42 brokerage houses
Material Topics
- Energy and Emissions
- Climate change
- Human Capital Management
- Customer Trust and Integrity
- Corporate Governance and Ethical Conduct
- Responsible Value chain Management
- Data Privacy and Cyber Security
- Economic Growth and Risk Management
How we engage
- Maintained continuous engagement with a diverse base of domestic and foreign investors through a balanced mix of oneon-one and group interactions.
Significant topics raised
- Business strategy and growth
- Financial performance and dividends
- Corporate governance
- ESG performance and disclosures
- Risk management and regulatory compliance
Engagement platform/ Frequency
- Engagements were conducted through both virtual and in-person formats, leveraging a variety of platforms including investor conferences, non-deal roadshows (NDRs), and other investor interaction opportunities.
SDGs Impacted

Dividend Distribution
When recommending dividends, our Board considers a range of internal and external factors, as mentioned below:
Internal
- Profits earned during the financial year
- Retained earnings
- Earnings outlook for the next three to five years
- Expected future capital/ liquidity requirements
- Any other relevant factors and material events
External
- Macroeconomic environment
- Regulatory changes
- Technological changes
Dividend Per Share (in `)
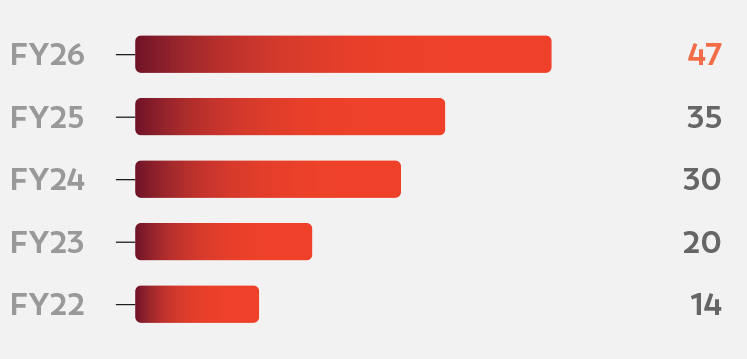
Dividend Payout Ratio (%)
Increasing Return on Investment
Since listing, we have delivered strong growth, achieving a 51% CAGR in market capitalisation, from `76 billion in 16 April 2019 to `~1.4 trillion as of May 2026, reflecting sustained investor confidence. Over the same period, we have steadily increased our dividend payout ratio to 27.2%, reinforcing our commitment to sharing the value we create. Our approach remains focused on sustainable returns, consistent growth and responsible financial management to drive long-term shareholder value.
Five-Year Shareholder Returns (%)
Economic Value Creation
| FY 2025-26 | FY 2024-25 | |
|---|---|---|
| Revenue from operations | 288,838 | 224,083 |
| Revenues from other sources | 2,363 | 2,076 |
| Direct economic value generated (a) | 291,200 | 226,159 |
| Operating expenses | 2,39,986 | 187,113 |
| Employee wages and benefit | 8,794 | 7,367 |
| Payments to providers of capital | 5,473 | 4,511 |
| Payment to Government (Income Tax) | 8,830 | 6,331 |
| Community investments | 455 | 356 |
| Economic value distributed (b) | 2,63,538 | 205,678 |
| Economic value retained (a-b) | 27,662 | 20,481 |
Financial Performance
In FY 2025–26, Polycab delivered another year of strong financial performance, reporting revenue of `288,838 million, up 29% YoY. EBITDA rose 35% YoY to `40,057 million, while RoCE stood at 31.5%, reflecting strong operational efficiency and disciplined capital allocation. We also invested `14.8 billion in capex, reinforcing our commitment to sustainable growth.
Growth in revenue
Growth in PAT
Growth in EBITDA
Capital Allocation Roadmap
We have identified four key ways to utilise our cash.
Capex
Capital expenditure remains a strategic priority. This year, we invested `14.8 billion in capex, up from `9.6 billion last year, focusing on capacity expansion, backward integration, automation and technology upgrades to enhance efficiency and strengthen manufacturing capabilities. In line with Project Spring, we plan to invest `60-80 billion over the next five years to support long-term growth and build a future-ready business.
Dividends
We have steadily increased our dividend payout since listing, rising from `3 per share in FY 2018-19 to `47 per share in FY 2025-26, reflecting a firm commitment to creating shareholder value while driving long-term business growth.
Mergers and Acquisitions
We are actively exploring inorganic growth opportunities to strengthen our capabilities and reinforce our position in the Wires & Cables sector.
Cash Reserves
We will retain a portion of our cash as a balance sheet buffer to maintain flexibility in both favourable and challenging business conditions.
Consistent Growth Trajectory
Revenue Growth (in `Mn)
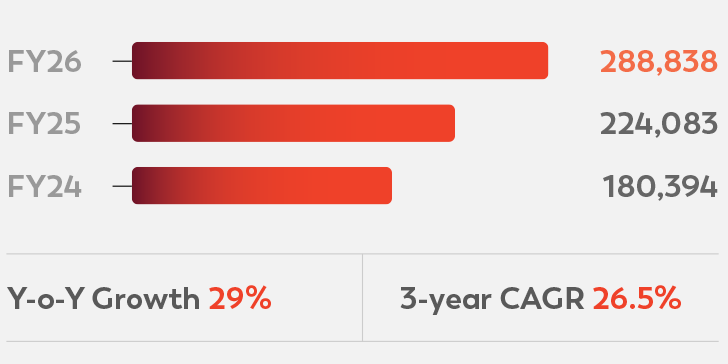
Why we measure it
To assess our ability to grow the business consistently across cycles and market conditions.
Performance narrative
Revenue increased by 29% in FY 2025-26, supported by strong demand in Wires & Cables and improved execution across channels and projects.
EBITDA Growth (in `Mn)

Why we measure it
To evaluate operational efficiency and value creation.
Performance narrative
EBITDA margin improved to 35% in FY 2025-26, driven by pricing discipline, efficiency gains, and favourable product mix.
Profit After Tax (PAT) (in `Mn)
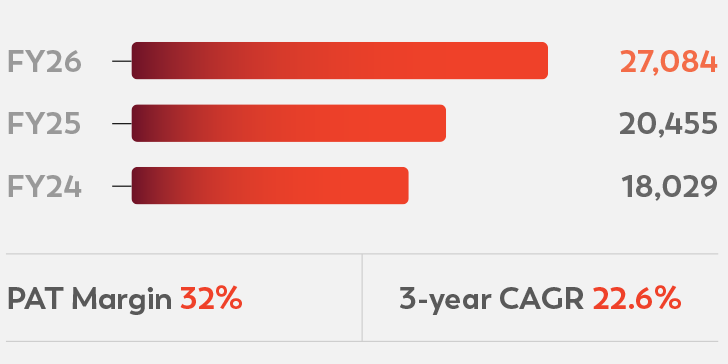
Why we measure it
To monitor profitability and ensure sustainable value creation.
Performance narrative
PAT rose by 32% in FY 2025-26, driven by cost optimisation, improved leverage and strong sales.
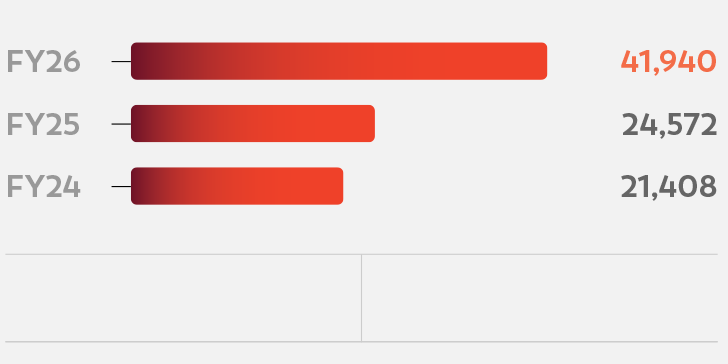
Market Capitalisation (in `Mn)
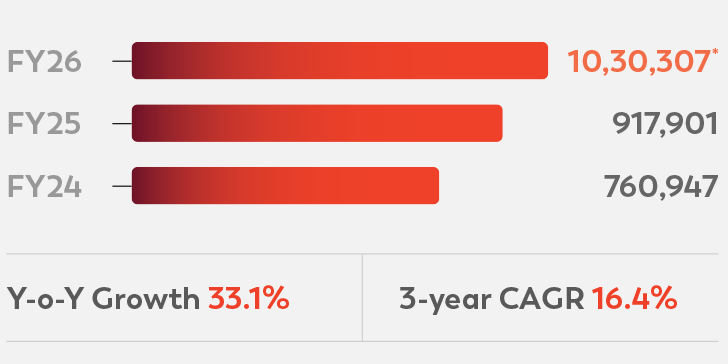
Why we measure it
To maintain financial resilience and support investments.
Performance narrative
Our net cash position strengthened further to `41,940 Mn in FY 2025-26, enabling growth investments and enhancing balance-sheet strength.
Net Cash Position (in `Mn)
Why we measure it
To gauge how the market values our performance and strategy. Market capitalisation shows investor confidence, shaped by revenue, profitability, governance, and industry standing.
Performance narrative
Our market capitalisation surged by FY 2025-26, driven by better execution, healthier margins and strong cash generation. This has strengthened investor confidence in our Wires & Cables leadership, which are well-positioned to drive sustained growth.
Capex (in `Mn)
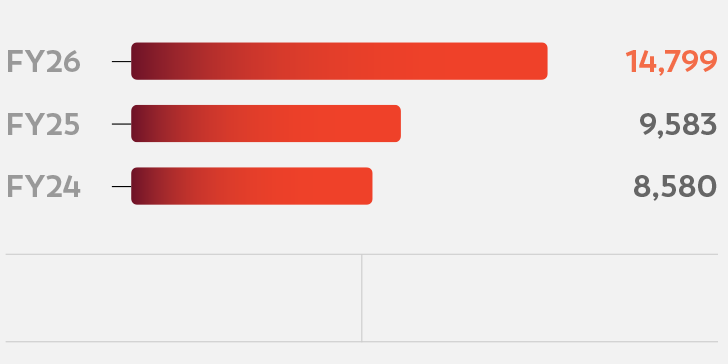
Why we measure it
To monitor our investments in capacity expansion, technology and operational efficiency.
Performance narrative
Our capex for the year rose substantially as we invested in automation, backward integration and facility upgrades under Project Spring to enable higher productivity, improved quality and deeper market penetration.
Debt/Equity Ratio
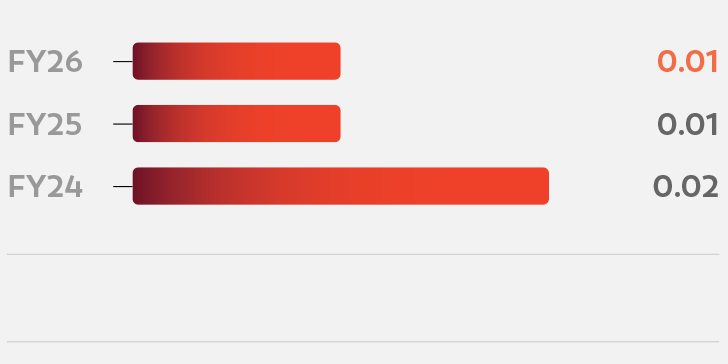
Why we measure it
To assess our balance-sheet strength and financial stability. A low debt-equity ratio indicates prudent leverage, disciplined capital management, and strong internal cash generation.
Performance narrative
Our debt-equity ratio remained exceptionally low at 0.01 in FY 2025-26, reflecting a strong balance sheet and efficient working capital management. Healthy cash flows allowed us to fund growth internally while maintaining minimal dependence on external borrowing.
Earnings per Share (in `)
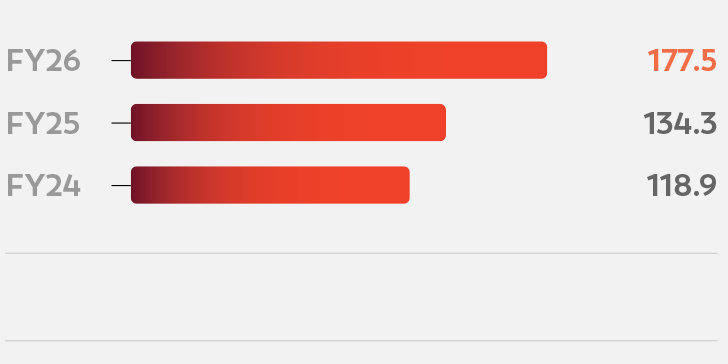
Why we measure it
To evaluate the value delivered to shareholders and track the growth of net profit on a per-share basis. EPS is a key indicator of profitability, capital efficiency and long-term shareholder value creation.
Performance narrative
EPS increased steadily to `177.5 in FY 2025-26, driven by strong revenue growth, margin expansion and improved operating leverage. Enhanced product mix and disciplined cost control further contributed to bottom-line performance and shareholder returns.
* As of 31 March 2026
