Management Discussion and Analysis
The global economy in FY 2024-25 navigated a dynamic environment shaped by evolving macroeconomic conditions, geopolitical uncertainties and policy shifts across major economies. Despite significant challenges, global economic growth demonstrated resilience, supported by ongoing technological advancements, infrastructure investments and a recovery in global trade. According to the International Monetary Fund (IMF), the global economy is estimated to have grown by 3.2% in 2024, with Advanced Economies growing at 1.7% and Emerging and Developing Economies registering a growth of 4.2%.
The U.S. economy experienced robust growth in 2024, ending the year with a 2.8% increase in real GDP. This positive performance was driven by strong consumer spending, government spending and rising business investment, offset by a slight decrease in net trade. The Federal Reserve maintained a cautious stance through most part of the year, ensuring that inflationary pressures were contained. However, seeping weakness in growth led the Fed to change their stance and cut rates by 100 bps between October and December 2024. In Q1 CY 2025, growth was negatively impacted reflecting uncertainties around trade policies and potential fiscal tightening.
In Europe, economic activity showed signs of stabilisation, supported by increased government spending on infrastructure, energy transition initiatives and technology adoption. Despite energy security concerns and supply chain disruptions in certain sectors, the European Union's concerted policy measures facilitated a moderate pace of growth.
China maintained its position as a key driver of global economic growth, despite structural property sector and demographic challenges. The government’s continued emphasis on infrastructure development and green energy transition facilitated steady economic progress. Additionally, proactive monetary and fiscal policy measures enabled China to mitigate external trade pressures and maintain stable growth momentum.
The Asia-Pacific region, excluding China, witnessed mixed economic performance. While countries such as India, Vietnam and Indonesia experienced robust growth driven by domestic demand and infrastructure investment, other economies faced growth slowdowns due to external trade dependencies and commodity price volatility.
The global economy is projected to grow at a stable but modest pace of 2.8-3.3% in 2025, slightly below the pre-pandemic average of 3.2%. The U.S. is expected to remain a key growth driver, though trade policies and tariffs could introduce inflationary pressures. The Eurozone is anticipated to see gradual recovery, supported by ECB rate cuts but vulnerable to external shocks. China’s growth is forecast to slow, constrained by structural issues and trade tensions, despite stimulus efforts.
Emerging markets will contribute significantly to global growth. However, downside risks dominate, including escalating trade barriers, geopolitical conflicts and climate-related disruptions. Global inflation is expected to decline to 3.4-4.2%, but persistent services inflation and potential trade wars could delay monetary easing. Policymakers must balance fiscal sustainability with growthenhancing reforms to navigate this uncertain landscape.
The volatility in commodity prices intensified significantly in FY 2024-25 compared to the previous year, reflecting shifting macroeconomic conditions, geopolitical tensions and global supply chain disruptions. The year witnessed sharp price fluctuations across key raw materials such as Copper, Aluminium, Steel and PVC compounds, impacting input costs across industries.
Initially, tight global financial conditions, weakened global trade and policy shifts in major economies created downward pressure on commodities. However, supplyside constraints and resilient industrial demand resulted in a renewed uptrend in the second half of the fiscal year. While China’s economic slowdown weighed on overall commodity demand, infrastructure spending, renewable energy investments and rising electric mobility adoption continued to drive long-term consumption.
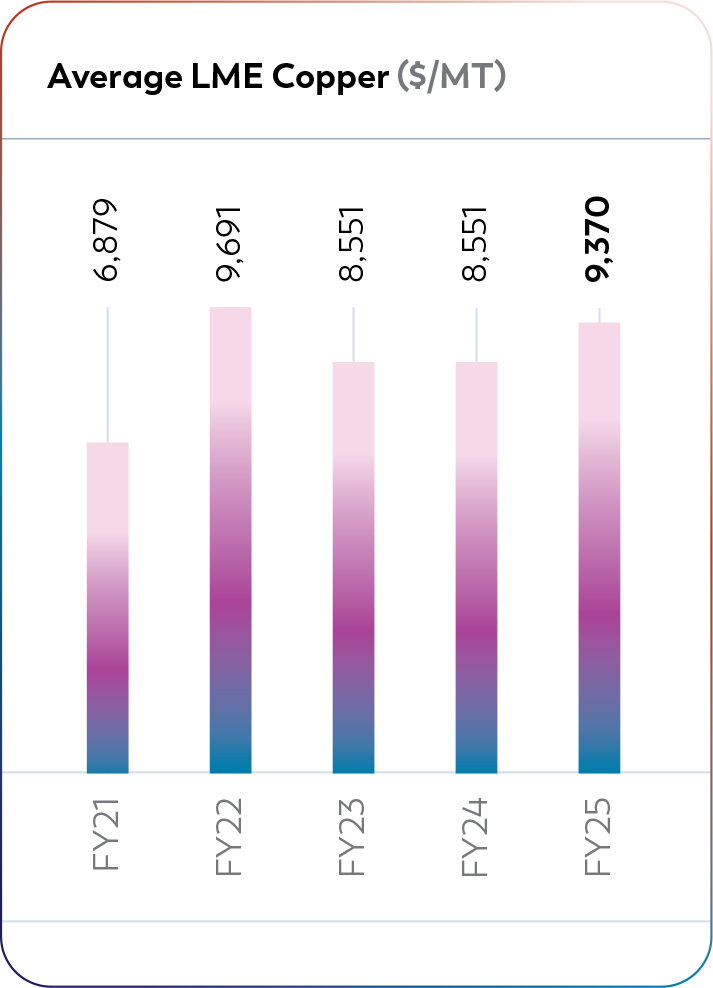
Copper prices on the London Metal Exchange (LME) experienced considerable volatility throughout FY 2024-25. The year opened with copper prices at $9,482 per metric tonne (MT) in April 2024, reaching a high of $10,129 per MT in May 2024, driven by increased global demand across key industries. However, the following months witnessed a gradual decline in prices, reaching a low of $8,920 per MT in December 2024, amid slower industrial demand, higher supply from key copper-producing nations and subdued economic activity. By the end of FY 2024-25, copper prices rebounded to $9,731 per MT in March 2025, reflecting improved economic sentiment, stronger demand from emerging markets and continued investments across industries.
$9,370 per MT
Average Copper Price in FY 2024-25

A similar trend was observed in aluminium prices, which remained volatile during the year. Aluminium prices opened at $2,498 per MT in April 2024 and peaked at $2,565 per MT in May 2024, supported by increased demand from the construction, automotive and renewable energy sectors. However, prices witnessed a gradual softening through July and August 2024, reaching a low of $2,334 per MT in August 2024, primarily due to increased global supply and softened industrial demand. The prices rebounded strongly towards the end of the fiscal year, closing at $2,657 per MT in March 2025, aided by rising global infrastructure spending, increasing demand from the electric mobility sector and supply chain constraints in major producing regions.
$2,526 per MT
Average Aluminium Price in FY 2024-25
The demand for both copper and aluminium remained robust, underpinned by growing applications in electric vehicles (EVs), renewable energy installations and infrastructure development. Increased investments in power transmission and distribution (T&D), 5G network infrastructure, solar power installations and electric vehicle charging stations continued to drive demand for both commodities.
The PVC compound, widely used for insulation in wires and cables, exhibited significant price swings during the year.
Prices surged in Q1 FY 2024-25, largely due to supply chain disruptions and increased feedstock costs, before witnessing a correction in Q2 as supply conditions improved. Towards the end of the fiscal year, demand recovery in industrial projects contributed to a rebound in PVC prices.
The steel market, a key component in the production of metal products, exhibited volatility throughout FY 2024-25. Steel prices mostly trended downward during the first half of the fiscal year, influenced by slower global demand and higher production output. However, from September 2024, maintenance-related production cuts and rising orders from infrastructure projects temporarily stabilised prices. The trend reversed again in November 2024, as excess supply and weak global trade continued to weigh on prices.
The Indian rupee experienced significant depreciation against the U.S. dollar during FY 2024-25. The exchange rate, which was `83.45 per USD in April 2024, crossed the `85 mark by December 2024. This depreciation was influenced by several factors, including rising crude oil prices, increased external debt and U.S. trade policies. By March 2025, the rupee further weakened, to be `86-87 against the U.S. dollar due to changes in policies by the U.S. and trade war risks.

India’s economy exhibited robust resilience in FY 2024-25, achieving a real GDP growth of 6.5%, retaining its position as the world’s fastest growing major economy and remains firmly on track to become the fourth-largest economy. This growth was largely fueled by resilient domestic demand, with private final consumption expenditure growing steadily — signaling a sustained recovery in rural sentiment and consumer confidence.
The 6.5% real GDP growth reflects India’s steady economic momentum despite a challenging global environment. While agriculture and services remained key contributors — with record Kharif output supporting rural incomes and the services sector sustaining pre-pandemic growth levels — the manufacturing sector experienced some softness due to subdued global trade. Nonetheless, India’s growth trajectory remains firmly anchored in structural domestic drivers and a broadbased recovery across sectors.
6.5%
Real GDP growth in FY 2024–25
Industrial activity showed signs of moderation in FY 2024-25. The Index of Industrial Production (IIP) grew by 4.0% during FY 2024-25, down from 5.9% in the corresponding period of the previous fiscal.
3.34%
India’s CPI-based retail inflation in March 2025
India’s retail inflation, measured by the Consumer Price Index (CPI), eased to 3.34% in March 2025, the lowest rate in over five years. This decline was driven by softening food prices. Food inflation fell to 2.69%, its lowest since November 2021. Core inflation remained near historic lows, indicating moderate underlying price pressures. The favourable monsoon outlook is expected to further stabilise food prices. The RBI expects average inflation to trend lower to 3.7% in FY 2025-26 from an estimated 4.6% in FY 2024-25.
3.7%
RBI’s forecast for average inflation in FY 2025–26
In response to mounting risks to economic growth and favourable inflation trends, the Reserve Bank of India (RBI) adopted an accommodative monetary policy stance. The RBI lowered the key repo rate by 100 basis points to 5.5% and announced plans for a significant liquidity infusion. These measures aim to ensure effective monetary policy transmission and support economic growth.
India’s external sector faced challenges due to global trade uncertainties and geopolitical tensions. Merchandise exports were constrained by weak global demand and potential tariff wars. However, services exports performed better, providing some cushion to the external sector. The Indian rupee experienced volatility, influenced by global factors such as fluctuating U.S. tariff policies. Despite some relief from a weakened U.S. dollar, market sentiment remained cautious.
6.3% – 6.8%
Projected GDP growth range for India in FY 2025–26
Looking ahead, India’s economy is projected to grow between 6.3% and 6.8% in FY 2025- 26. The favourable monsoon forecast is expected to boost agricultural output and stabilise food prices, supporting rural consumption. The RBI’s accommodative monetary policy stance, coupled with liquidity infusion measures is anticipated to stimulate investment and consumption. However, global uncertainties including trade tensions and geopolitical risks, may pose challenges. Continued focus on structural reforms, infrastructure development and digitalisation will be crucial in sustaining economic growth and enhancing resilience.

The Indian W&C industry emerged as one of the best performing industries in India in FY 2024-25, maintaining its strong growth trajectory of past 3 years. Driven by government-led infrastructure development, rising power sector investments, expanding real estate and investments in domestic manufacturing, the industry grew by ~12% YoY reaching ~`900 billion in FY 2024-25 . The industry remains a crucial component of India’s electrical ecosystem, catering to diverse applications across residential, commercial, industrial and infrastructure projects, contributing around ~40-45% of Indian electrical industry.
~`900 billion
Indian Wires and Cables industry size in FY 2024–25 (~12% YoY Growth)
The first half of FY 2024-25 witnessed a temporary moderation in government capital expenditure due to the general elections. However, the second half saw a recovery in project rollouts and fund disbursements. Despite this brief slowdown, the cables segment registered robust growth throughout the year, driven by execution of ongoing projects. Ministries such as Railways and Road Transport & Highways maintained near-full utilisation of their budgets — continuing the trend from recent years. Furthermore, the Union Budget for FY 2025- 26 increased infrastructure allocations by 17%, including grant-inaid for creation of capital assets to state governments, signalling continued focus on infrastructure growth. Significant boosts in allocation were observed across priority areas such as power, affordable housing (Pradhan Mantri Awaas Yojana), BharatNet (rural broadband), metros, Smart Cities, water projects and defence, all of which are strong demand generators for wires and cables.
17% increase
In infrastructure allocations in the Union Budget for FY 2025–26
The power sector emerged as a strong pillar of demand, with significant investments made under the National Electricity Plan. Projects across generation, transmission and distribution moved at pace, supported by growing demand for electricity and a strategic shift toward renewable sources. The solar and wind energy sectors, in particular, triggered strong demand for specialised cables suited for high-capacity and weather-resilient applications. Several state electricity boards and private discoms placed orders to strengthen their networks in anticipation of increased loads, which contributed to a surge in demand for both power and control cables.
The real estate market saw one of its strongest years in over a decade. According to an industry report, residential launches in calendar year 2024 were the highest in the past decade, while home sales reached a 15-year peak. This momentum translated into sustained demand for electrical infrastructure, particularly cables, which are typically required in early stages of construction. Demand for wires — used largely in the middle stages — also picked up as more projects moved toward completion. The commercial and premium housing segments, in particular, contributed significantly to the uptrend, given their higher quality specifications and need for superior electrical components.
On the private capex front, investments remained steady in sectors such as cement, automobiles and electronics. These industries continued expanding capacity and modernising operations, leading to incremental demand for industrial-grade cables. Notably, emerging sectors like data centres, electric vehicles (EVs) and defence manufacturing registered strong growth. Data centre, in particular, require high volumes of structured cabling and fire-resistant solutions, while the EV sector has seen demand rise for high-voltage and fastcharging cable systems. The government’s continued push for local defence production under the Atmanirbhar Bharat initiative has also started to yield traction, offering a new avenue for specialised cable applications.
Gross Fixed Capital Formation (GFCF), a key indicator of capital investment, inched up in FY 2024-25, though it still remains below historical peaks. However, improved capacity utilisation across industries, coupled with a favourable borrowing environment and rising consumption, suggest a positive outlook for private capex in FY 2025-26 and beyond.
Organised players continued to gain market share through brand trust, compliance with safety and quality standards and better reach. The demand shift toward branded and certified products is also being driven by regulatory changes and increasing awareness among institutional and retail buyers. Factors like digitised supply chains, pan-India distributor networks and broader product portfolios helped organised firms strengthen their leadership further during the year.
The Indian W&C industry is expected to continue growing at a pace close to 2x the real GDP growth rate in the near- to midterm. This growth outlook is underpinned by strong policy support from the government in terms of infrastructure investment, sustained capital allocation to power and housing sectors and a steady pipeline of public-private partnership (PPP) projects. Additionally, private sector capex is expected to improve, aided by softening borrowing costs, rising consumption and increased industrial activity. Companies that focus on innovation, sustainability and market responsiveness are likely to benefit most as the next phase of growth unfolds.
The global W&C industry is estimated to have grown in mid-single digits in FY 2024-25, as it continues to witness strong demand across power transmission, construction, industrial manufacturing and telecommunications, as governments worldwide focus on grid modernisation, smart city development and clean energy transitions to support economic and sustainability goals.
The renewable energy sector remained a major growth driver for the industry, with significant investments in solar, wind and energy storage projects globally. Countries such as the United States, China and members of the European Union have accelerated their efforts to decarbonise their energy systems, leading to higher demand for high-voltage transmission cables, solar cables and offshore wind farm interconnects. The U.S. alone is projected to add 300-350 GW of solar and wind capacity by 2029, while the EU plans to add 200 GW of wind and 350 GW of solar capacity over the same period, driving demand for expansion and modernisation projects.
The telecommunications sector remains a key demand driver, supported by 5G expansion, fiber-optic deployments and increasing data center capacity worldwide. With the rapid digitalisation of economies, the demand for fiber-optic cables, high-speed data transmission networks and submarine cables has grown significantly. The global fiberoptic cable market has witnessed a surge in investments, particularly in North America, Europe and Asia-Pacific, as countries enhance their broadband infrastructure.
The ‘China Plus One’ strategy has also contributed to the industry’s growth, as global companies diversify their supply chains to mitigate risks associated with over-reliance on China. This shift has resulted in sourcing from W&C manufacturers in countries such as India, South Korea, Vietnam, Taiwan and Mexico, boosting exports from these regions.
Looking ahead, the global W&C industry is expected to sustain its growth momentum, supported by continued investments in renewable energy, power transmission infrastructure, high-speed connectivity and industrial automation. The industry is poised to benefit from rising urbanisation, increasing electricity consumption and the expansion of electric mobility solutions, ensuring sustained demand for advanced and high-performance cable solutions.
Overall, with India’s strong manufacturing capabilities, expanding production capacity and improving export competitiveness, Indian W&C manufacturers are wellpositioned to capture the rising global demand. The industry’s cost efficiencies, adherence to international quality standards and ability to meet diverse market needs make it a strong contender in the global market. As international businesses continue to seek reliable alternatives beyond China, Indian manufacturers stand to benefit significantly, driving export growth and strengthening India’s position in the global W&C industry.


The FMEG industry in India continued to grow at a mid-to-high single-digit pace in FY 2024-25. While this growth reflects the sector’s resilience, it also underscores the absence of any significant pickup in broadbased consumption. Demand remained somewhat subdued in the B2C segment, largely due to cautious consumer spending and high interest rates in the first half of the fiscal. However, B2B demand offered strong support to the industry, especially on the back of sustained infrastructure investments by the central government in areas such as housing, railways, smart cities and public utilities.
The fans category registered a solid recovery in FY 2024-25, bouncing back from the dampened season seen in the previous year. The growth was largely led by the rising adoption of energy-efficient models, particularly BLDC (Brushless Direct Current) fans. These fans gained significant traction as consumers became more aware of their long-term energy savings, largely due to continued outreach and education efforts by manufacturers. The transition to Bureau of Energy Efficiency (BEE) norms also tilted the scales in favour of organised players who were better equipped to meet compliance requirements. In contrast, many unorganised manufacturers struggled to adapt, resulting in a notable shift in market share towards established brands. From a financial standpoint, the category witnessed both volume and value growth. Manufacturers were able to pass on higher input costs, including those from the adoption of BLDC technology, to end consumers without significantly dampening demand. This not only improved realisations but also drove margin expansion for players with strong brand equity.
The Lighting & Luminaires (L&L) segment continued to face headwinds, particularly due to pricing pressure stemming from the proliferation of Driver on Board (DOB) technology in LED lights. However, FY 2024- 25 saw the rate of pricing deterioration slow, indicating a potential stabilisation in the segment. Industry participants expect prices to bottom out in FY 2025- 26, aided by rising costs of compliance. B2B demand in this segment remained relatively strong, supported by commercial and institutional projects, while B2C demand was more muted. The first half of the fiscal year was notably sluggish, but demand picked up during the festive season starting with Diwali in Q3 and continued its upward trajectory through Q4. One of the encouraging trends in L&L has been the shift in consumer preferences toward decorative and ambient lighting solutions, moving beyond basic bulbs and battens. This change in buying behaviour is contributing to improved value realisation, allowing manufacturers to introduce higher-margin SKUs. As aesthetics and energy efficiency increasingly guide consumer choices, premium lighting is poised to be a major growth driver in the coming years.
The switchgear and switches categories both continued their upward momentum, benefiting directly from the strong performance of the real estate sector. Within the switches space, the year saw several new entrants, especially from the unorganised sector, indicating growing interest in this segment’s long-term potential. New product innovations, enhanced designs and modular features are increasingly becoming differentiators in the segment, as consumers seek style along with functionality. Switchgears, meanwhile, continued to be a stronghold of organised players due to the safety-critical nature of the product and the relatively high entry barriers.
Overall, FY 2024-25 was a mixed but stable year for the FMEG industry. While B2C demand remained modest, B2B projects and regulatory tailwinds provided necessary impetus across categories. The transition toward energy-efficient and premium products supported margin resilience and organised players continued to consolidate their position. With structural shifts underway — ranging from consumer behaviour to compliance and design preferences — the industry is poised for more accelerated and differentiated growth in FY 2025-26 and beyond.
Detailed discussions on the macrotrends that will govern the future growth of W&C and FMEG industries can be found on Read More
The W&C segment continued its strong growth momentum, registering a growth of 18% YoY to reach H188,881 million, representing 84% of total sales. The robust performance was driven by healthy domestic demand benefitting from higher government capital expenditure on mobility sector and power sector especially renewable energy projects and continued real estate offtake, which boosted demand for our product portfolio.
`188,881 Mn
Revenue in the Wires & Cables segment, growing 18% YoY
Despite fluctuations in raw material prices, the segment effectively navigated cost pressures through a robust hedging framework, including contracts with embedded derivatives and forward contracts. This approach ensured margin stability in a volatile commodity price environment. Additionally, strategic pricing actions further contributed to profitability.
Geographically, growth was broad-based, with the highest growth recorded in the West region, followed by the South, North and East. In terms of revenue contribution, the West remained the largest contributor, followed by the South, North and East. Both, domestic distribution business and institutional business exhibited strong growth.
In line with past 2 years’ trend, cables growth outpaced wires growth. The segment’s strong performance is estimated to have resulted in organised W&C market share gains for the Company of about 1% to stand at 26%-27%.
At the profitability level, the Company was able to maintain its margins in the W&C business at 13.62% for the year, within the guided range. This was achieved through strategic pricing revisions and improved operational efficiencies, which contributed to better cost management and enhanced operating leverage.
A notable growth lever during the year was the Revamped Distribution Sector Scheme (RDSS), under which the Company secured multiple significant orders. The RDSS initiative, aimed at strengthening the power distribution ecosystem in the country, allowed the Company to participate extensively in projects across states. The scheme not only boosted volumes but also deepened the Company’s engagement in the power utilities segment.
Looking ahead, the Company is wellpositioned to benefit from opportunities under the BharatNet project, India’s flagship rural broadband connectivity initiative. With upcoming orders under this scheme, the Company expects to expand its footprint in the fibre optic cable space, a segment poised for exponential growth driven by digital inclusion, data center expansion and 5G rollouts.
In addition to external demand drivers, internal transformation initiatives under Project LEAP provided a strong operational foundation for this growth. The merger of High-Density Cable (HDC) and Low-Density Cable (LDC) verticals brought enhanced focus and synergy, while targeted expansion into whitespace geographies enabled the Company to access previously underserved markets. Efforts to increase throughput from existing distributors also paid off, improving channel efficiency and expanding market coverage.
These strategic moves not only accelerated growth during the year but also helped the Company gain incremental market share in a competitive environment. The domestic W&C business continues to serve as a cornerstone of the Company’s portfolio, delivering consistent performance and aligning with the broader vision of becoming a preferred and comprehensive solutions provider for India’s evolving infrastructure needs.
In FY 2024-25, Polycab’s international cables business closed the year with revenues of `13,452 million, contributing 6% to the Company’s overall turnover. While exports remained a strategically significant segment, the business experienced a modest degrowth during the year, primarily due to structural and geopolitical challenges. One of the key factors impacting performance was the transition of our U.S. business model – from an institutional sales approach to a distribution-led model. The U.S. has historically been one of Polycab’s largest export geographies and the temporary disruption caused by this transition had an adverse impact on volumes during the first half of the year.
In parallel, the Red Sea crisis, triggered by conflict in the Middle East, disrupted major trade routes to the U.S., Europe and the Gulf region, leading to shipping delays and elevated freight costs. These logistics bottlenecks added to the headwinds faced during the fiscal.
However, by the end of FY 2024-25, key inflection points were reached. The transition to a hybrid business model in the U.S. – leveraging both distributors and institutional customers — is now complete. This structure is expected to offer better reach, improved agility and greater scalability across customer segments. Additionally, the de-escalation of tensions in the Red Sea region have started to ease supply chain constraints, leading to a more normalised trade flow into strategic global markets.
Despite these temporary hurdles, Polycab retains its position as one of India’s leading cable exporters, with a footprint spanning 80+ countries. The Company’s strong order book, scheduled for execution over the next 12 months, provides clear visibility of robust performance ahead. Demand momentum is strong from core markets such as the Middle East, U.S., Australia and Europe, where infrastructure development, energy transition and digitisation are driving demand for high-performance cable solutions.
Global demand fundamentals remain compelling. Investments in renewable energy projects, the upgradation of aging power grids, rapid deployment of data centres and large-scale capex in the oil & gas sector are all strong tailwinds for the cable export business. The APAC region, particularly Australia, is poised for high growth on the back of its ambitious renewables agenda and planned infrastructure pipeline. Meanwhile, North America and Europe are witnessing a surge in demand, driven by grid modernisation and energy transformation. Europe’s leadership in renewable technology deployment and its accelerating LNG infrastructure expansion will also provide sustained opportunities for cable manufacturers. In the Middle East and Africa, large-scale infrastructure developments, especially in the UAE and Saudi Arabia, are creating a robust ecosystem for electrical products. Likewise, the LATAM region, particularly Chile and Brazil, presents opportunities through mining and energy projects that require robust and specialised cable solutions.
Polycab has charted a clear roadmap to capture these global opportunities. The Company’s strategy includes expansion into new geographies, deepening presence in current markets and achieving approvals from large global EPCs — an important prerequisite for participating in marquee international projects. Simultaneously, Polycab is reinforcing its value proposition with a sharp focus on the three pillars of Cost, Quality and Delivery (CQD), ensuring that its solutions remain competitive, compliant and reliable across diverse regulatory environments.
With structural improvements now in place, stabilised trade routes and growing global demand across sectors, FY 2025-26 is expected to mark a strong rebound for the cable exports business, with material growth anticipated over the performance in FY 2024-25.
The SPC Business Unit specialises in e-Beam cross-linked cables, designed to withstand high voltage and extreme temperature conditions, making them ideal for Railways, Defence and Automotive applications. The product portfolio caters to critical systems such as railway coaches, locomotives, battleships, submarines, commercial vehicles (CVs) and electric vehicles (EVs), ensuring high performance and durability in demanding environments.
During the year, the SPC business witnessed softness, primarily due to the slower awarding of projects in the first half of the year, as a result of general and state elections. However, demand is expected to pick up going forward, driven primarily by the Railways and Defence segments. The key growth enablers for the business include a diverse product portfolio, strong customer engagement and enhanced operational focus.
The year saw the Railways business growth being impacted on account of soft tendering and awarding activity from the government’s side. However, the Company had a positive development in the form of orders received to supply cables to the Vande Bharat trains. These orders should materialise in FY 2025-26, aiding the growth of the SPC business. The Defence segment registered decent growth as the Company supplied cables to several ship-building projects during the year. The automobiles segment too saw healthy traction as the Company supplied AC charging cables for EV charging stations.
During the year, the Company’s new plant for manufacturing SPC cables became operational. This dedicated facility will support the division’s ability to cater to evolving industry needs and capture opportunities in emerging sectors.
The domestic wires business delivered a healthy performance in FY 2024–25, continuing its upward trajectory on the back of strong macro and sectoral tailwinds. Growth was driven by a combination of factors, including robust activity in the residential and commercial real estate sectors, rising rural electrification and the ongoing expansion of infrastructure across the country. The business benefitted significantly from government-led housing initiatives, electrification schemes in underserved regions and an increasing preference among consumers and contractors for high-quality, fire-resistant and energy-efficient wiring solutions.
The real estate sector remained a cornerstone of demand for the wires segment. Accelerated urbanisation, rising income levels and favourable demographics contributed to increased housing demand. Real estate developers maintained a strong launch pipeline, marking the highest number of new launches in over a decade, a trend that has now held firm for three consecutive years. With launches outpacing sales, a significant pipeline of under-construction homes is expected to translate into higher demand for wires and low-voltage wiring solutions with a lag of 1.5 to 2 years, providing strong visibility for future growth.

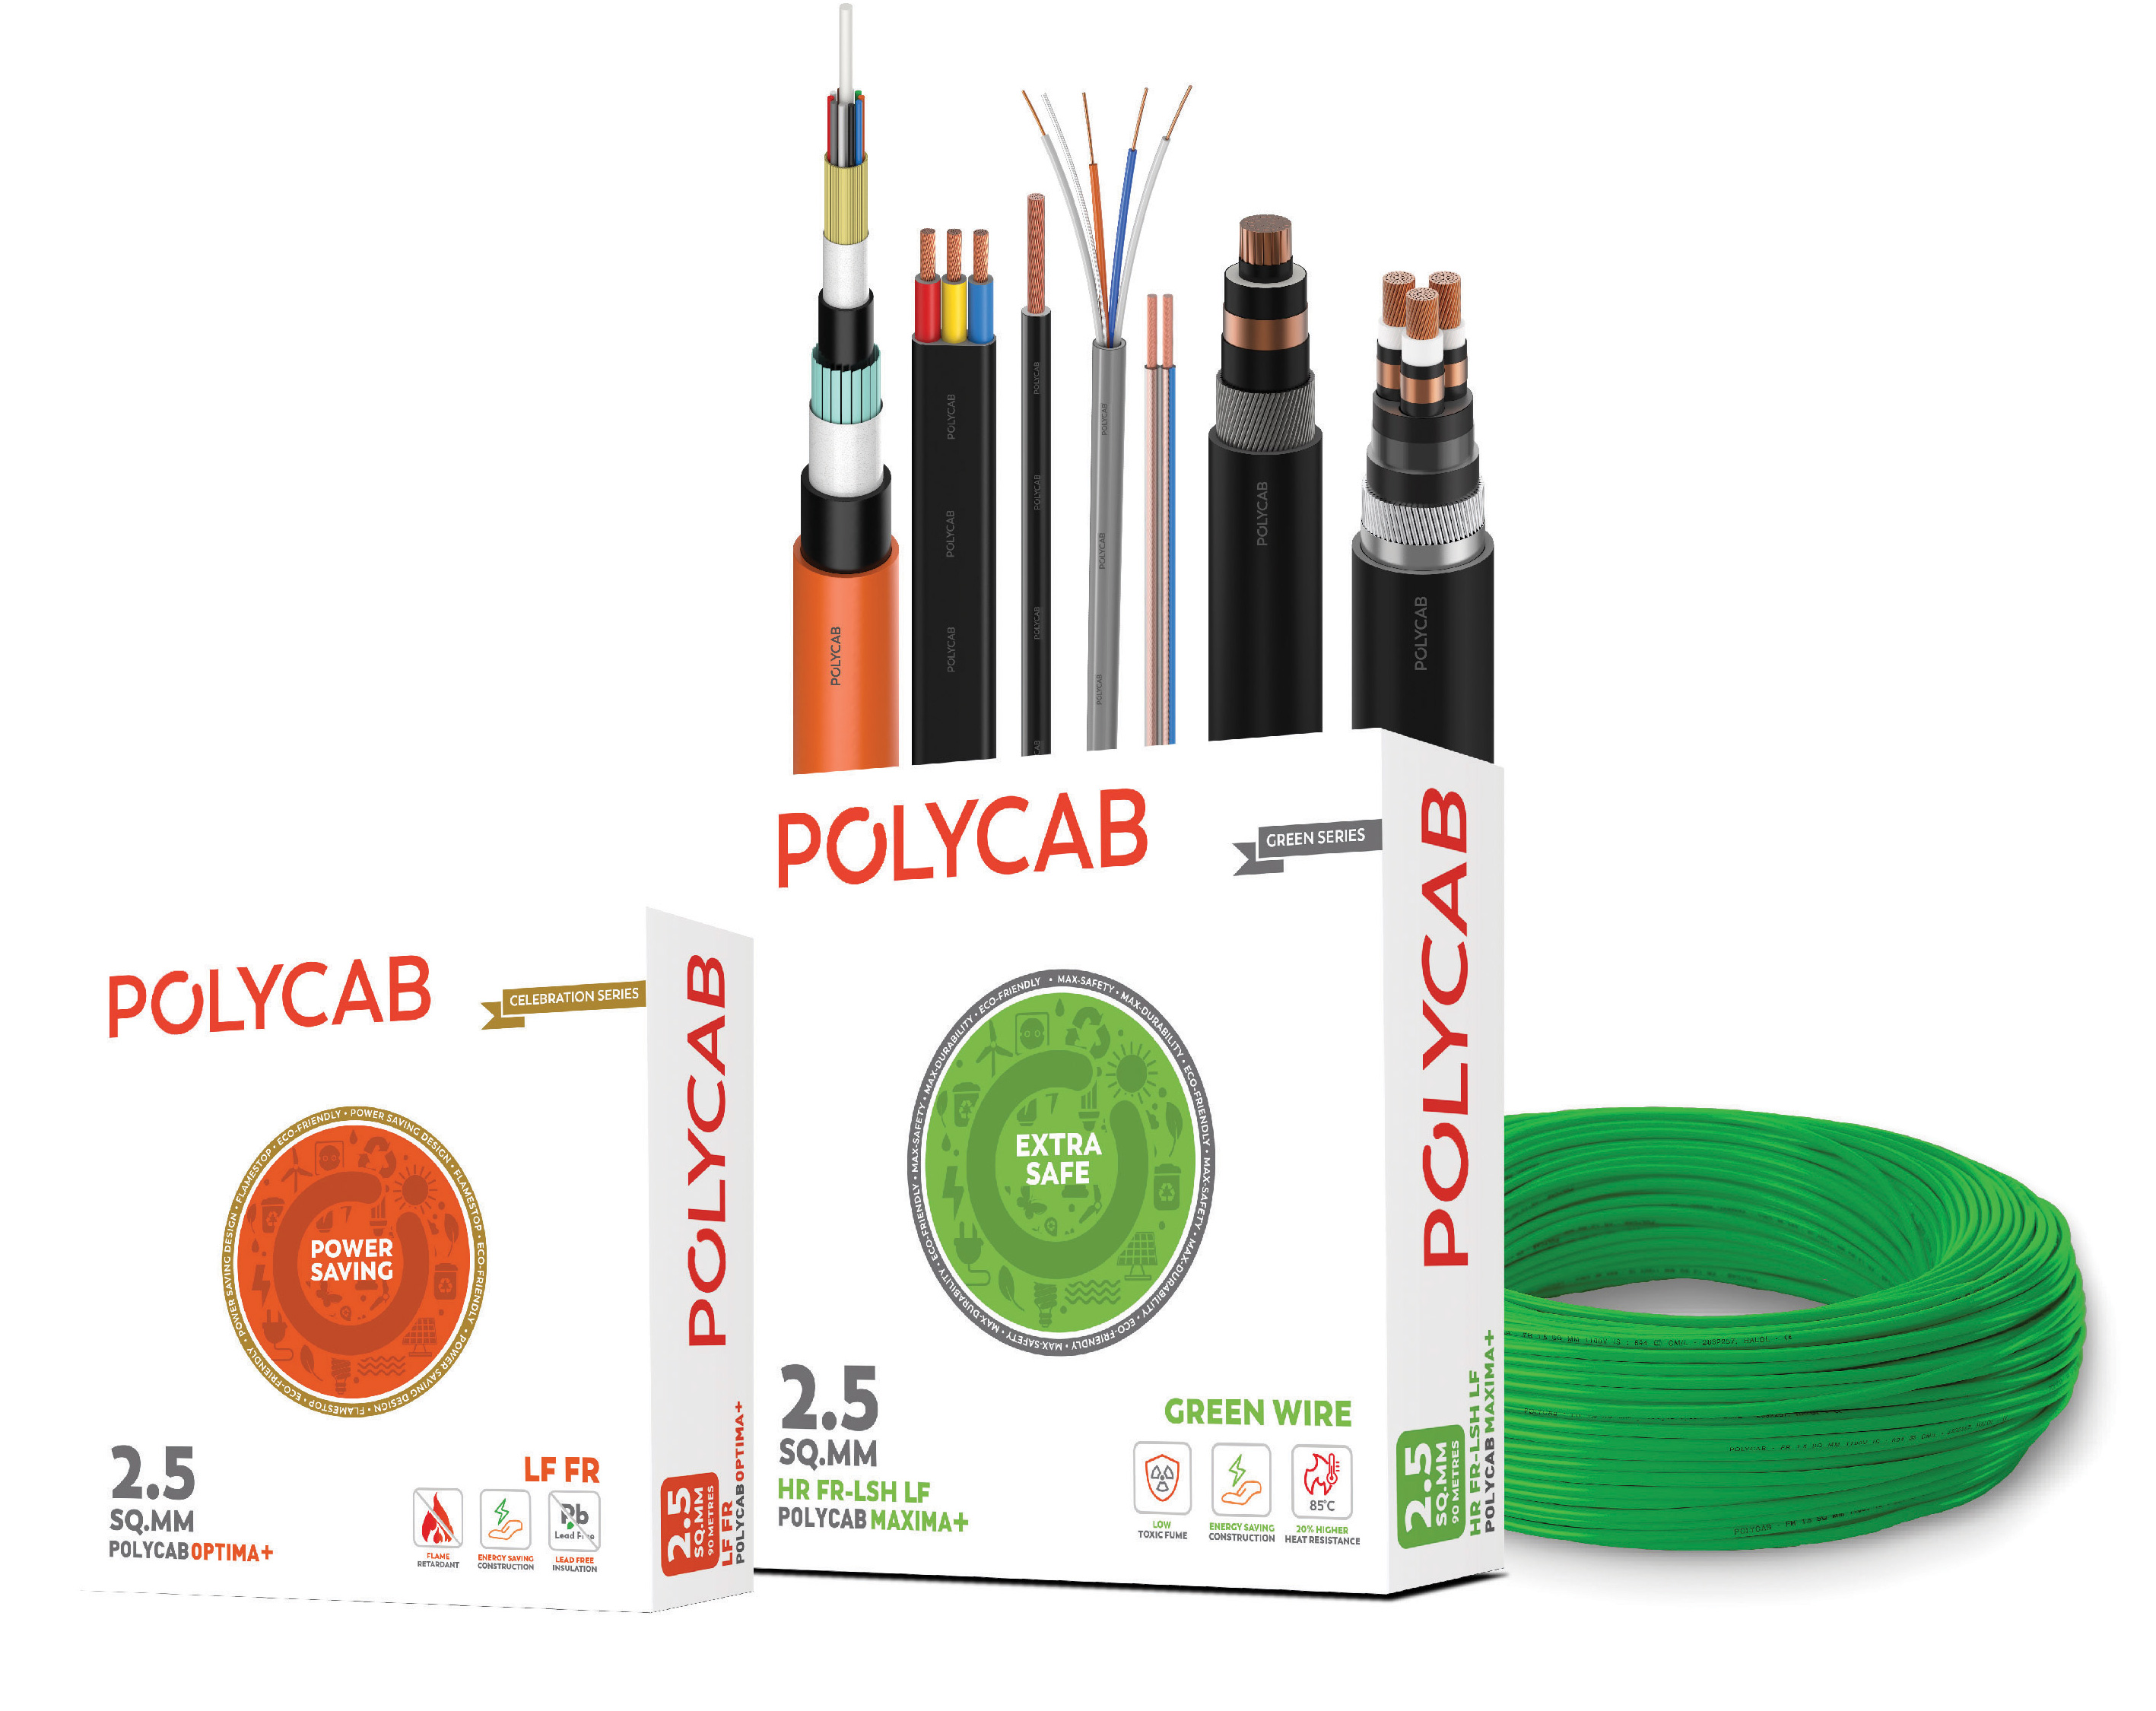
Consumer demand has also evolved in terms of product expectations. There’s a growing shift toward fire-retardant, low-smoke and halogen-free (FRLSH) wires, reflecting increased awareness of safety, sustainability and compliance with modern building codes. This has led to a pronounced uptick in demand for premium, certified wiring solutions, particularly in large-scale real estate developments, smart city projects and commercial establishments.
In response to these evolving consumer needs and price sensitivities, the Company has successfully implemented a price laddering strategy, enabling it to offer differentiated value propositions across customer segments. Over the last three years, new product lines such as Etira, Primma, Maxima+ and Suprema have been launched to cater to varying consumer priorities — ranging from entry-level to premium offerings. Collectively, these new-age wire solutions accounted for over 47% of the Company’s total wire sales in FY 2024-25, underlining their widespread market acceptance and the effectiveness of the tiered product strategy.
47%
Share of new-age wire solutions in total wire sales during FY 2024–25
To further strengthen its leadership across regions, the Company deployed regionspecific go-to-market (GTM) strategies that emphasised local distribution expansion, regional product customisations and tailored marketing efforts. These efforts allowed the Company to deepen its presence in underpenetrated markets, especially in Tier 2 and Tier 3 cities, where demand is growing rapidly in tandem with infrastructure development and residential expansion.
Recognising the pivotal role of influencers in driving product adoption at the grassroots level, the Company also undertook several initiatives to enhance engagement with electricians and retailers. At the beginning of the fiscal year, the Company launched an enhanced Experts App, providing a seamless and intuitive digital interface for stakeholders to earn, redeem and track loyalty rewards. These apps featured smoother navigation, faster credit and redemption of points and additional features designed to improve user experience.
In parallel, the Company introduced the Utkarsh Programme, a focused initiative to upskill electricians, equipping them with updated knowledge on modern wiring systems, safety norms and product innovations. The programme aims to create a network of well-informed and certified professionals who serve as key brand advocates and technical consultants at the point of installation.
Looking ahead, the Company will focus on consolidating its market-leading position in the wires segment. With a robust product portfolio, expanded geographic footprint, strong engagement with influencers and continued investments in innovation and quality, the wires business is well-positioned to sustain its growth momentum in the coming years.
The W&C business continues to be the cornerstone of Polycab’s growth strategy and was instrumental in enabling the Company to achieve the ambitious revenue milestone under Project LEAP ahead of schedule. The strong and sustained performance of this segment — driven by a diverse demand base spanning power, infrastructure, real estate, industrial and exports — has played a foundational role in shaping the Company’s market leadership and financial resilience.
As we transition into Project Spring, the next five-year strategic phase, the Company remains committed to maintaining the strong growth trajectory of its W&C business. The underlying demand environment continues to remain highly favourable, supported by long-term macroeconomic and sectoral tailwinds.
The domestic market is poised for strong and sustained growth, supported by increasing infrastructure investments, rising electrification and expansion in key end-user industries. The government’s Viksit Bharat 2047 vision, aimed at transforming India into a developed nation, continues to drive largescale investments in power transmission & distribution (T&D), metro rail, smart cities, highways and industrial corridors. Additionally, the real estate sector, which is currently experiencing a multi-year upcycle, is expected to reach `1 trillion by 2030 and `1.5 trillion by 2034, further fuelling demand for high-quality electrical solutions. The power sector is also undergoing a major transformation, with increasing emphasis on grid modernisation, renewable integration and last-mile connectivity under programs like RDSS and the National Electricity Plan. These trends are set to drive demand for high-quality, durable cables and fire-safe wiring solutions, reinforcing Polycab’s leadership in both B2B and B2C segments.
On the international front, the Company expects a meaningful rebound in export volumes in FY 2025-26, aided by the successful transition to a hybrid distributioninstitutional model in the U.S., easing trade route challenges and a strong global order book. Growth is expected to be broad-based, with key markets like the Middle East, U.S., Australia and Europe seeing increased cable demand from investments in renewables, power infrastructure, oil & gas and data centers. Strategic efforts to expand into new geographies, enhance product certifications and deepen engagements with large EPC players are expected to accelerate global scale and brand visibility.

As part of Project Spring, the Company has outlined a structured growth roadmap to further strengthen its leadership position. The Company aims to grow its W&C business at approximately 1.5x the industry growth, with the industry itself expected to expand at 1.5-2x of real GDP growth. International business is also expected to contribute meaningfully to overall growth, with plans to increase the export revenue share to over 10% of total revenue by FY 2029- 30. To support this ambitious expansion, the Company has committed a capital expenditure of `60-80 billion over the next five years, generating asset turn of 4x to 5x.
As the single largest revenue and earnings contributor, the W&C segment will remain central to the Company’s vision of delivering sustainable, profitable and inclusive growth through the Project Spring journey and beyond.
The FMEG business registered exceptional growth of 29% during the year, contributing 7% of the Company’s top-line. The robust performance was driven by the successful execution of various strategic initiatives, including business restructuring, channel expansion, product architecture enhancements, brand building and the expansion of the influencer management program. These efforts have contributed to strong revenue expansion across all product categories, reinforcing the Company’s position in the highly competitive FMEG industry. Moreover, after registering losses for 10 quarters on account of investments in capacity expansion, team expansion, increased in A&P and R&D spends, the business became profitable during the last quarter of the year. This is an important inflection point for the FMEG business, whereby, going ahead, this business is expected to generate consistent improvement in profitability and contribute to the Company’s bottom-line growth.
During the year, the Company actively pursued a multi-pronged growth strategy to further strengthen its presence in the FMEG industry and capitalise on emerging opportunities. A key focus was on expanding the distribution network into previously untapped markets, ensuring greater accessibility and deeper market penetration. The Company added 300+ FMEG distributors during the year, taking the total count of FMEG distributors to ~3,400.

Additionally, the Company placed significant emphasis on new product development, launching many new SKUs across all FMEG product categories, ensuring a diverse range of offerings across various price segments to maximise market potential and meet evolving consumer demands.
To better address regional demand variations and enhance consumer reach, the Company initiated with adopting a micro-market strategy, segmenting key geographies into smaller, high-potential clusters based on local market dynamics, economic activity and consumer behaviour. This strategy allows for customised product positioning, targeted marketing efforts and optimised distribution, ensuring that each micro-market’s unique demand patterns are effectively addressed. By leveraging datadriven insights and localised engagement strategies, the Company is strengthening its ability to drive higher sales conversion, improve service levels and deepen brand presence across urban, semi-urban and rural markets.
The Company remains committed to enhancing brand visibility, consumer engagement and loyalty, consolidating its market position and driving sustained long-term growth. During the year, the Company undertook a number of abovethe-line (ATL) and below-the-line (BTL) marketing initiatives curated as per the target customer segment of each product category. In line with the evolving electrical solutions landscape, the Company’s target is to increase its A&P spends to be in the range of 3%-5% of the B2C top-line, ensuring consistent brand-building efforts while maintaining financial discipline.
The Company’s efforts towards restructuring the FMEG business, by creating separate product-level verticals, helped further accelerate growth and improve operational efficiency, allowing for a sharper focus on individual product categories, optimised decision-making and improved resource allocation. This transition is expected to enhance performance across the segment, streamline processes and drive sustainable growth in the long-term.
With these structural improvements and strategic initiatives in place, the Company remains well-positioned to capture market share and establish itself as a leading player in the segment.
The Indian fans industry grew in mid-single digits to reach `165 billion in size and is projected to expand at a CAGR of 7% till FY 2029-30, reaching a market size of `230 billion. The Company’s fans business recorded strong growth of 25%+ during the year, supported by rising consumer demand, expanding distribution reach and increasing adoption of energy-efficient models. The segment benefitted from premiumisation trends, growing urbanisation and heightened awareness of energy efficiency, which drove demand for BLDC fans and premium fans.
`230 Bn
Projected market size of the Indian fans industry by FY 2029–30
The Company continued to enhance its product portfolio, catering to diverse consumer preferences across different price segments. The Company’s focus on design innovation, superior performance and durability has reinforced consumer confidence, supporting higher sales volumes. Currently, the premium category contributes 18% of the total fan revenue and the Company aims to further increase its share to 30-35% in line with industry trends.
During the year, the Company introduced 100+ new SKUs, expanded geographical presence into more than 350 towns, adding ~280 new channel partners and ~8,000 retailers.
~280
New channel partners added in fans business
~8,000
Retailers added to the fans business network
By leveraging robust R&D capabilities and in-house manufacturing, the Company remains committed to consistently delivering superior quality products that meet evolving consumer demands. With strong distribution expansion, deeper market penetration and a growing preference for energy-efficient and smart fans, the Company is wellpositioned to capture further market share in the segment.

The L&L industry in India continues to evolve, driven by technological advancements and changing consumer preference for smart lighting and architectural LED solutions. During the year, the industry grew by high single-digit to reach `277 billion in size.
`277 Bn
Market size of the Lighting and Luminaires (L&L) industry
The Lighting industry continued to face pricing challenges during the year, with price erosion of over 15% in FY 2024-25, following 30%+ in FY 2023-24 and 20%+ in FY 2022- 23. The cost deflation in technology have led to continued price declines across the B2C lighting segment, impacting growth. However, despite these headwinds, the Company’s L&L segment had a healthy performance, registering high-teen value and 25%+ volume growth, aided by Company’s internal initiatives.
During the year, Polycab continued to expand its product portfolio, introducing 190+ new SKUs with a focus on premium and technologically advanced lighting solutions. Additionally, the Company expanded its geographical reach into more than 650 towns, strengthening its distribution network with the addition of 170+ distributors in new geographies and 11,500+ retailers. The Company accelerated its efforts towards brand positioning and investments in R&D reinforcing its commitment to delivering innovative, energy-efficient and sustainable lighting solutions.
170+
Distributors added in new geographies for the L&L business
11,500+
Retailers added to the L&L business network
Looking ahead, the L&L business is expected to benefit from increasing urbanisation, smart city developments and the growing preference for premium and smart lighting solutions. The Company remains focused on product innovation, expanding its distribution footprint and deepening its presence in the premium lighting segment, ensuring long-term sustainable growth.

In FY 2024-25, the B2C switches and the low-voltage switchgears industry is expected to have grown in early double digits and high single digits respectively to reach `100 billion and `27 billion in size, respectively. The Company’s Switches & Switchgears business recorded strong growth of ~30% during the year, supported by higher real estate activity, increased urban development and rising demand in residential and commercial segments.
~30%
Growth in the Switches & Switchgears business during the year
The switches category continued to gain traction, with the Etira series, catering to the demand for cost-effective solutions, playing a pivotal role in driving sales during the year. Additionally, the Levanna series, positioned as a premium offering, made good contribution, reflecting the increasing shift toward high-end and design-oriented switches. The segment’s success was further supported by the Company’s in-house manufacturing and deepening market penetration across urban and semiurban areas.
The switchgear business demonstrated robust growth, benefiting from higher demand for quality circuit protection devices in real estate projects. The 6kA MCBs launched last year received good response, with the range contributing 12% of total switchgear sales during the year. Through consistent growth of last few years, Polycab now counts itself among the Top 5 Indian B2C switchgear companies by market share. Moreover, the switchgears business in now a double-digit EBITDA business for the Company.
A strategic focus on cross-selling opportunities through the existing wire distributor network are yielding positive results, allowing the Company to leverage its strong distribution ecosystem to enhance product reach and sales efficiency. To maintain the highest quality standards, the Company manufactures all components in-house, ensuring the use of premium raw materials and precisionengineered components that meet strict industry standards.
Looking ahead, the Switches & Switchgears business is well-positioned for sustained growth, supported by rising infrastructure investments, increased adoption of smart home solutions and growing demand for energy-efficient and safety-compliant electrical systems. The Company remains focused on product innovation, further distribution expansion and increasing the contribution of switches and switchgear within the FMEG segment, ensuring longterm profitable growth in the category.
The Conduits and Fittings business registered 20%+ growth, leveraging the sustained strong momentum in the real estate sector. Conduits and fittings play a crucial role in routing and safeguarding electrical wiring, manufactured from premium-grade waterproof and fireresistant polymers to ensure enhanced safety and durability for electrical circuits. Typically installed within walls, these products are low-ticket items, often resulting in relatively lower customer awareness regarding quality standards.
The market for conduits and fittings remains highly fragmented, with low barriers to entry and a significant share held by unorganised players, accounting for approximately 35-40% of the total market. As of FY 2024-25, the market size for conduits and fittings stood at `81 billion, presenting significant growth opportunities for organised players.
Recognising the vast potential within this segment, the Company remains strategically focused on strengthening its market position. Key initiatives include leveraging cross-selling opportunities through the existing W&C distribution network, expanding the direct-to-consumer (D2C) channel and driving consumer education through quality awareness campaigns. These efforts are expected to enhance market penetration, improve brand visibility and accelerate the adoption of high-quality conduit solutions.
With rising awareness about electrical safety, fire-resistant installations and structured cabling requirements in commercial buildings, data centers and smart city projects, the demand for premium conduit solutions is expected to grow steadily.

Our other FMEG business primarily comprises solar products, which recorded exceptional performance during the year. The segment grew nearly 2.5 times YoY, becoming the third-largest category within our FMEG portfolio. This growth was driven by strong tailwinds from government initiatives such as the PM Surya Ghar Yojana, state-level rooftop solar subsidy programmes and increasing consumer adoption of renewable energy solutions.
Significant demand was observed across key states including Maharashtra, Gujarat, Rajasthan, Telangana, Madhya Pradesh, Uttar Pradesh and Tamil Nadu, which continue to lead in rooftop solar installations. With continued policy support and rising awareness, the momentum in these markets is expected to sustain over the near to medium-term.
Our solar portfolio is focused primarily on solar inverters. We are expanding our range to cover systems up to 325 kW, This strategic expansion enhances our ability to cater to both residential and commercial customer segments across diverse energy needs.
The FMEG industry in India is poised for growth, supported by favourable demographics, rapid urbanisation, rising disposable income and increasing brand consciousness among consumers. The real estate upcycle, infrastructure expansion and growing preference for premium and energy-efficient electrical solutions are further driving demand across both residential and commercial segments. Additionally, government-led initiatives such as smart cities, electrification projects and housing development continue to create new opportunities for the industry.
The FMEG industry is expected to grow at a CAGR of 8-10%, fuelled by higher adoption of premium products, increasing consumer spending and technological advancements. Premiumisation remains a key trend, with consumers shifting toward energy-efficient and smart electrical products such as BLDC fans, modular switches, smart lighting and automation-enabled electrical solutions. The lighting segment is also undergoing a transformation, with a growing preference for architectural LED solutions and connected lighting systems.
8–10%
CAGR expected for the FMEG industry
Under Project Spring, the Company aims to accelerate the growth of its FMEG business, targeting a pace of 1.5x to 2x the market growth and positioning itself among the top players across key product categories by FY 2029-30. This strategy will be driven by distribution expansion, portfolio diversification and increased brand investments. The Company is scaling its presence in Tier-2 and Tier-3 cities, enhancing its influencer management programme and deepening engagement with electricians, contractors and retailers to strengthen consumer reach.
The institutionalisation of a micro-market strategy remains a core pillar of the growth roadmap, allowing the Company to address regional demand variations with tailored product offerings and localised marketing strategies. By leveraging data analytics and digitisation, the Company aims to enhance supply chain efficiency, optimise inventory management and improve service levels across all key markets.
To support its long-term growth, the Company continues to invest in inhouse manufacturing capabilities, automation and process optimisation, ensuring cost efficiency and improved margins. The Company is targeting to achieve EBITDA margins of 8-10% by FY 2029-30.
With a strong foundation, increasing demand for high-quality electrical solutions and a focused execution plan, the FMEG business is well-positioned for sustained growth, stronger market share and longterm profitability.
Engineering Procurement & Construction (EPC) business, recorded revenue of `19 billion, registering a YoY growth of 143%. The growth was largely driven by projects awarded under the Revamped Distribution Sector Scheme (RDSS) by the government, which has significantly expanded the Company’s order book, ensuring a healthy pipeline of projects for execution over the next 2-3 years.
`19 Bn
Revenue from the EPC business
The segment EBIT stood at ~`2 billion, with EBIT margins at 9.41%, reflecting strong execution capabilities and disciplined cost management. The segment contributed 9% to the Company’s total sales during the year.
With increased government focus on strengthening power distribution infrastructure, rural electrification and smart grid implementation, the EPC business remains well-positioned to capitalise on emerging opportunities. The Company continues to focus on timely execution of projects, improving operational efficiencies and selectively bidding for high-margin projects, ensuring sustained growth and profitability in this segment.
The EPC business remains a strategic lever for the Company, primarily serving as a forward integration tool to drive incremental demand for W&C rather than a standalone revenue driver. The Company’s presence in the EPC space allows it to secure large infrastructure projects with significant cabling requirements, maximising the off take of its core products.
As of March 2025, the Company had a robust EPC order book of approximately `70 billion, which is expected to be executed over the next two to three years, ensuring consistent revenue visibility. Additionally, the BharatNet project is expected to contribute to EPC revenues from FY 2025-26 onwards, while incremental order inflows from Extra High Voltage (EHV) projects from FY 2026- 27 will further supplement the segment’s top-line.
~`70 Bn
EPC order book as of March 2025
Despite these growth opportunities, the Company does not anticipate EPC to scale materially in comparison to its core business areas and its revenue contribution is expected to remain in the high single digits as a percentage of overall Company revenue. The strategic focus will remain on securing infrastructure projects where the EPC model enables a significant demand-pull for W&C, thereby driving core business growth rather than scaling EPC as an independent highgrowth vertical.
From a profitability perspective, the Company is working toward maintaining stable and sustainable margins within the EPC business. While the segment has historically operated at 10-11% EBIT margins, the long-term sustainable margin target is expected to normalise in the mid-to-high single digit range, in-line with industry benchmarks. However, by bundling large cable supplies within EPC contracts, the Company effectively preserves overall profitability while ensuring the efficient scaling of the W&C business.
Looking ahead, the Company will continue to bid selectively for large infrastructure projects where its core product portfolio can benefit, particularly in power transmission, smart grids and fiber network expansion initiatives such as BharatNet. As capabilities in EHV projects expand and participation in large-scale transmission infrastructure strengthens, the EPC segment is expected to deliver incremental value while maintaining a disciplined execution approach.
In summary, EPC will continue to play a strategic role, serving as a demandgeneration mechanism for W&C while maintaining disciplined execution, mid-tohigh single-digit margins and a steady order book, ensuring that it remains an efficient and value-accretive segment within the Company’s broader portfolio.
The Company maintains a robust framework of internal controls that are in accordance with the nature and size of the business. The framework addresses the evolving risk complexities and underpins the Company’s strong corporate culture and good governance. The Internal Audit plan is approved by Audit Committee at the beginning of every year. The purpose of an internal audit is to examine and evaluate the internal controls and risks associated with the Company’s operations. It covers factories, warehouses and centrally controlled businesses and functions.
While these controls comply with the terms of the Companies Act, 2013 and the globally accepted framework issued by the Committee of Sponsoring Organisations (COSO) of the Treadway Commission, they are also regularly tested by statutory and internal auditors for their effectiveness. The framework is a combination of entity-level controls that include enterprise risk management, legal compliance framework, internal audit and anti-fraud mechanisms such as the Ethics Framework, Code of Conduct, Vigil Mechanism and Whistle-Blower Policy and process level controls, IT-based controls, period-end financial reporting and closing controls. The Company has clearly defined the policies, SOPs, Financial & Operation RAPID (Delegation of Authority) and organisational structure to ensure smooth conduct of its business. Technologies are leveraged in process standardisation, automation and their controls.
The extensive risk-based process of internal audits and management reviews provides assurance to the Board with respect to the adequacy and efficacy of internal controls. Internal audit reports are reviewed by the Audit Committee every quarter. Furthermore, the Committee also monitors the management actions implemented as a result of the internal audit reviews. Polycab is mindful of the fact that all internal control frameworks have limitations. Therefore, it conducts regular audits and review processes to ensure that the systems are continuously strengthened to improve effectiveness. The management has evaluated the operative effectiveness of these controls and noted no significant deficiencies or material weaknesses that might impact the financial statements as of 31 March 2025.
Polycab firmly believes that employees are the lifeblood of the Company, serving as its most valuable asset and driving force behind its success. Their dedication, creativity and passion fuel innovation, drive productivity and foster customer satisfaction. Moreover, employees embody the Company’s values and mission, serving as ambassadors both within the organisation and in the broader community. Recognising the significance of employees, Polycab prioritises their wellbeing, growth and engagement.

Diversity & Inclusion: Embracing diversity and fostering an inclusive workplace culture is paramount to the Company’s values. By respecting and valuing differences in perspectives, backgrounds and experiences, the Company enriches its work environment and promotes innovation and creativity.
Learning & Development: The Company prioritises investing in its employees’ development through various training programmes, workshops and continuous learning opportunities. By empowering employees to enhance their skills and knowledge, the Company fosters a culture of growth where individuals can thrive and reach their full potential. Recognising this, the Company introduced learning and development initiatives aimed at upskilling and reskilling its workforce.
Employee Engagement: Continuous employee engagement and feedback play a pivotal role in fostering a thriving organisational culture and driving sustained success. By actively involving employees in the decision-making process, soliciting their feedback and valuing their perspectives, the Company demonstrates its commitment to employee empowerment and development. This engagement not only enhances employee morale and satisfaction but also cultivates a sense of ownership and accountability among team members. Moreover, regular feedback loops enable the Company to identify areas for improvement, address concerns and adapt strategies to meet evolving needs and challenges. Ultimately, by prioritising continuous employee engagement and feedback, the Company fosters a culture of transparency, trust and collaboration, which in turn leads to higher levels of innovation, productivity and employee retention.
Rewards & Recognition: Acknowledging and appreciating employees’ contributions is integral to fostering a culture of excellence. The Company implements robust recognition and reward systems to celebrate achievements and encourage high performance. This not only motivates employees but also reinforces a sense of pride and ownership in their work.
Health, Safety and Well-being: The Company places strong emphasis on the physical, mental and emotional well-being of its workforce. Comprehensive health insurance, accident coverage and maternity benefits are extended to 100% of employees. To further strengthen its occupational health and safety (OHS) standards, the Company has implemented an OHS Management System aligned with ISO 45001:2018 across key manufacturing sites.
Initiatives such as the Continual Health Assessment and Improvement Programme ensure regular medical screenings and followup care. Awareness programmes, including those on mental health and emergency preparedness, foster a culture of safety and openness. Observances like National Safety Week and Fire Safety Week, along with hands-on drills and interactive events, encourage active employee engagement in safety practices. The introduction of SPARSH, a digitised HSE management system, has further enhanced real-time safety analytics, driving improvements in process discipline and accountability.
Human Rights: Respect for human rights is foundational to the Company’s values and operations. Guided by its Code of Conduct, the Company enforces fair and ethical treatment across all levels. It actively works to eliminate discrimination, prevent harassment and prohibit all forms of forced or child labour — both within the organisation and throughout its supply chain. Zero instances of complaints related to child, forced, or involuntary labour were reported during the year, reflecting the Company’s firm commitment to ethical labour practices and social responsibility.
Further details on the initiatives taken by the Company under the above heads are presented on pages of the Integrated Annual Report.
At the end of FY 2024-25, the Company had 16,884 employees and workers, on-rolls and contractual, working at its various offices, manufacturing plants and warehouses.
16,884
Employees and workers as of March 2025
Property, Plant, and Equipment (PPE) and Intangible Assets
- Total additions to PPE and Intangibles
were `9,127 million mainly on account of:
- Capitalisation of Freehold land of `720 million, which majorly includes land purchase at Daman for `416 million, Vadodara for `241 million and remaining at other location of Halol.
- Capitalisation of Building of `549 million, which largely includes factory building at Halol, and remaining for other capex projects of the Company.
- Capitalisation of Plant & Machinery of `7,282 million, largely for expansion of wires & cables segment.
- Capitalisation of various asset categories, including electrical installations (~`275 million), office equipment (~`235 million), and vehicles (~`21 million). Smaller additions were also made towards furniture, computer software, and leasehold improvements.
- Capital Work in Progress (CWIP) stood at `7,081 million as on 31 March 2025 largely attributed to the expansion of W&C segment followed by FMEG segment.
- Investment Property under Construction: The Company’s investment property consists of vacant land in Mumbai.
- During the year ended 31 March 2025, the Group recognised additions of `899 million to Right-of-Use assets, primarily relating to leased properties in Gujarat and Daman. In accordance with Ind AS 116, such leases are capitalised with corresponding lease liabilities and depreciated over the lease term.
- The Company has provided adequate depreciation and amortisation in accordance with the useful lives of the assets determined in compliance with the requirements of the Companies Act, 2013. In a certain class of assets, the group uses different useful life than those prescribed in schedule II of the Companies Act, 2013, as detailed under the accounting policy section of the financial statements.
Investments in Joint Ventures
Techno Electromech Private Limited
In 2017, the Company entered into a 50:50 strategic joint venture with Techno Electromech Private Limited (TEPL), a Vadodara-based manufacturer of LED lighting and luminaires. As of 31 March 2025, the joint venture has accumulated losses.
The Group has recognised its share of losses in the joint venture up to the extent of its investment in equity shares in prior years. In the absence of any legal or constructive obligation to fund the losses of the joint venture, the Group has discontinued recognising further losses. The Group will resume recognising its share of profits only when and to the extent that it has offset the previously unrecognised share of losses.
Other Financial Assets
As at 31 March 2025, Other Financial Assets increased by `1,213 million to `1,860 million, primarily driven by higher fixed deposits (`407 million), recognition of firm commitment assets (`318 million), premium receivables on EPC contracts (`191 million), and increases in interest receivables, embedded derivatives, and deposits (`297 million).
Other Assets
As of 31 March 2025, total other assets (non-current and current) decreased by `2,737 million, reaching `7,053 million. This decrease is mainly attributed to `2,163 million in balances with government authorities, `1,834 million decrease in advance for materials and services. This decrease is offset by increase in `717 million of contract assets, `271 million increase in prepaid expenses, and `31 million of export incentive receivables.
Inventories
As of 31 March 2025, the inventory stood at `36,613 million, down from `36,751 million as of 31 March 2024, marking a slight decrease of `138 million. This change is primarily due to decrease in finished goods and trading inventory by `4,432 million and `302 million which is offset by increase in finished goods and work in progress inventory by `3,894 million and `948 million respectively. Further, Inventory for long-term contracts and packing materials were reduced by `267 million and `148 million whereas stores and spares inventory increased by 103 million. Our inventory days, as derived from consolidated financial statements, were 79 days in FY 2024-25, compared to 101 days in FY 2023-24 ensuring higher efficiency and rollover.
Trade Receivables
As at 31 March 2025, total trade receivables stood at `28,957 million, reflecting an increase of `7,295 million over the previous year. This includes:
- Non-current Trade Receivables of `2,994 million (up `1,804 million), primarily comprising retention money from government EPC contracts.
- Current Trade Receivables of `25,963 million (up `5,492 million), primarily comprising channel and institutional customers. Our receivable days, based on consolidated financial statements, were 42 days in FY 2024-25, compared to 41 days in FY 2023-24.
Cash Position (Includes Cash and Cash Equivalent, other Bank Balances and Current Investments)
As at 31 March 2025, the Group’s cash position improved to `25,197 million from `22,248 million in the previous year.
Share Capital
As at 31 March 2025, the paid-up share capital stood at `1,504 million, comprising 15,04,25,898 equity shares of `10 each (31 March 2024: `1,502 million). The increase reflects the allotment of 1,89,503 equity shares under the Company’s ESOP schemes during the year.
Other Equity
As at 31 March 2025, Other Equity increased by `16,377 million to `96,746 million. Key components include:
- Retained Earnings rose by `15,620 million, reflecting profit for the year of `20,131 million, partially offset by a dividend payout of `4,511 million.
- Securities Premium increased by `437 million due to equity shares issued under the ESOP scheme.
- General Reserve grew by `15 million, primarily from unexercised ESOPs.
- ESOP Outstanding increased by `314 million, net of `687 million stock-based compensation expense and adjustments for exercised options and transfers.
- Foreign Currency Translation Reserve increased by `15 million due to currency conversion of foreign subsidiary financials.
Borrowings
As at 31 March 2025, total borrowings (non-current and current) stood at `1,090 million, up `192 million from the previous year. The increase was primarily due to a term loan facility availed by a subsidiary for capex requirements.
Other Financial Liability
As at 31 March 2025, Other Financial Liabilities increased by `135 million to `3,093 million. The increase was primarily driven by higher creditors for capital expenditure (`270 million), derivative liabilities on commodity and forward contracts (`66 million), and security deposits (`39 million). These were partially offset by reductions in channel financing liabilities (`132 million), interest accrued but not due (`65 million), and financial guarantee liabilities (`42 million).
Other Liability
As at 31 March 2025, other Liabilities increased by `394 million to `3,962 million. The increase was primarily driven by a higher deferred government grant (`480 million) related to pending export obligations, advances from customers (`266 million), and deferred and refund liabilities (`87 million). These were partially offset by reductions in statutory dues (`275 million) and contract liabilities (`163 million) due to revenue recognition.
Trade Payables (Including Acceptances)
As at 31 March 2025, trade payables (including acceptances) stood at `27,358 million, reflecting a decrease of `1,276 million compared to the previous year. The reduction was primarily due to a `5,557 million decline in acceptances, partially offset by a `4,282 million increase in trade creditors. Trade payable days improved to 59 days in FY 2024–25 from 79 days in FY 2023–24.
Provisions
As at 31 March 2025, the balance stood at `1,042 million, up `126 million from the previous year. The increase was mainly driven by higher provisions for compensated absences (`61 million), gratuity (`77 million), and warranty obligations (`56 million), partially offset by a reduction of `68 million in provisions for indirect tax matters.
Gratuity and compensated absences is based on the valuation from the independent actuary, with gratuity funded through a plan maintained with Life Insurance Corporation of India.The parent Company in India provides gratuity benefits for its employees wherein the plan is funded with the fund balance kept with the Life Insurance Corporation of India.
Deferred Tax Liability
As of 31 March 2025, the total balance was `1,025 million, compared to `544 million as of 31 March 2024, an increase of `481 million on account of tax impact on temporary differences.
Tax Asset / Liability
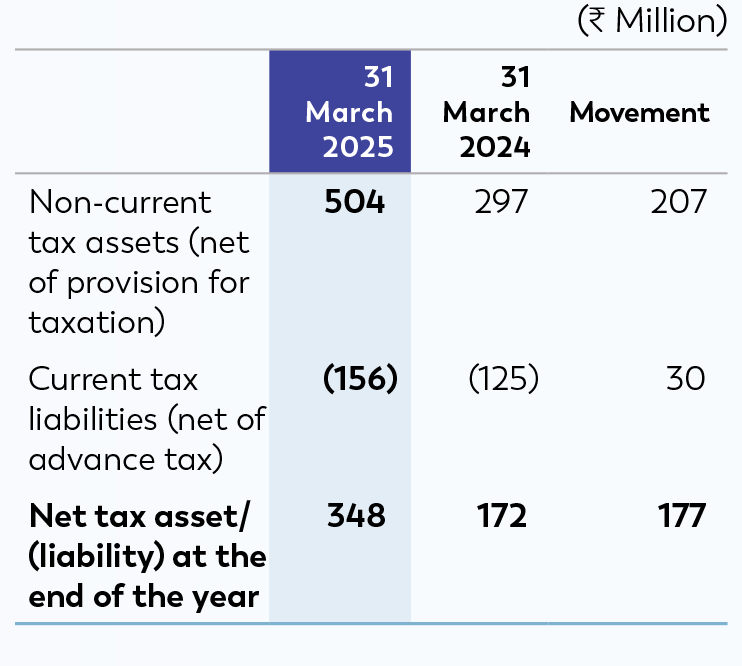
An increase of `177 million due to advance tax payment of `6,331 million, partially offset by tax provision of `6,155 million.
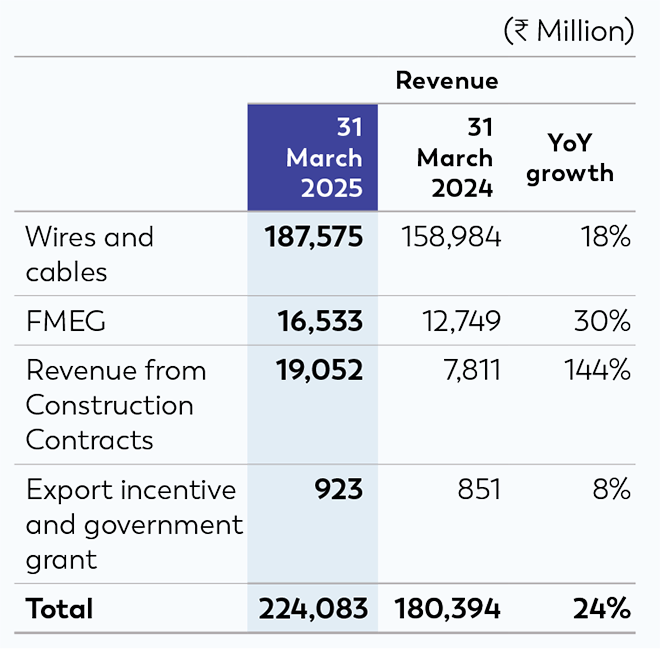
Revenue from Operations
Revenue from operations increased by 24% to 224,083 million in FY 2024-25 from `1,80,394 million in FY 2023-24. Our segment-wise growth is as below:
Other Income
Other income for FY 2024–25 was `2,076 million, a decrease of `132 million over the previous year. The decline was primarily due to lower exchange gains (`506 million), partially offset by increase in income from mutual fund investments (`342 million) and fair valuation of financial instruments (`44 million). Minor movements were also noted in interest income, miscellaneous income, and gain on asset sales.
Cost of Goods Sold (COGS)
The COGS includes cost of materials consumed, purchases of traded goods, changes in inventories, and project boughtouts. COGS, was `168,300 million in FY 2024–25, representing a 1.5% increase as a percentage of sales. This movement was primarily driven by change in sales mix from Domestic and Export business.
Employee Benefit Expenses
Employee expenses rose by `1,272 million to `7,367 million in FY 2024–25, marking a 21% increase, primarily due to annual increments, new hiring, and higher ESOPrelated charges. As a percentage of revenue, employee costs stood at 3.29% (FY 2023–24: 3.38%). ESOP compensation cost recognised during the year was I687 million, up from `564 million in the previous year.
Finance Cost
Finance cost largely includes interest cost, bank charges, and foreign exchange gains/ (losses) on borrowings. Our finance costs rose by `606 million to `1,689 million in FY 2024-25 primarily driven by a rise in LC-based procurement and additional term loans availed by group companies.
Depreciation and Amortisation Expense
Depreciation and amortisation expense increased to `2,981 million in FY 2024-25 from `2,450 million in FY 2023-24, an increase of `531 million, largely due to addition in PPE and Right of Use assets.
Other Expenses
Other expenses increased by `2,235 million to `18,813 million in FY 2024–25. As a percentage of revenue, it declined to 8.40% from 9.19%.
The increase was primarily driven by sub-contracting (`569 million), legal and professional fees (`430 million), power and fuel (`383 million), freight and forwarding (`248 million), insurance cost (`112 million), and travel (`190 million), repairs and maintenance (`89 million) and miscellaneous expenses (`966 million).
These were partially offset by decrease of `779 million in advertising and sales promotion, due to one-off spends in the previous year (e.g., ICC World Cup sponsorship, Brand refresh), Lower fair value loss on derivatives (`146 million) and impairment allowance for doubtful debts (`94 million).
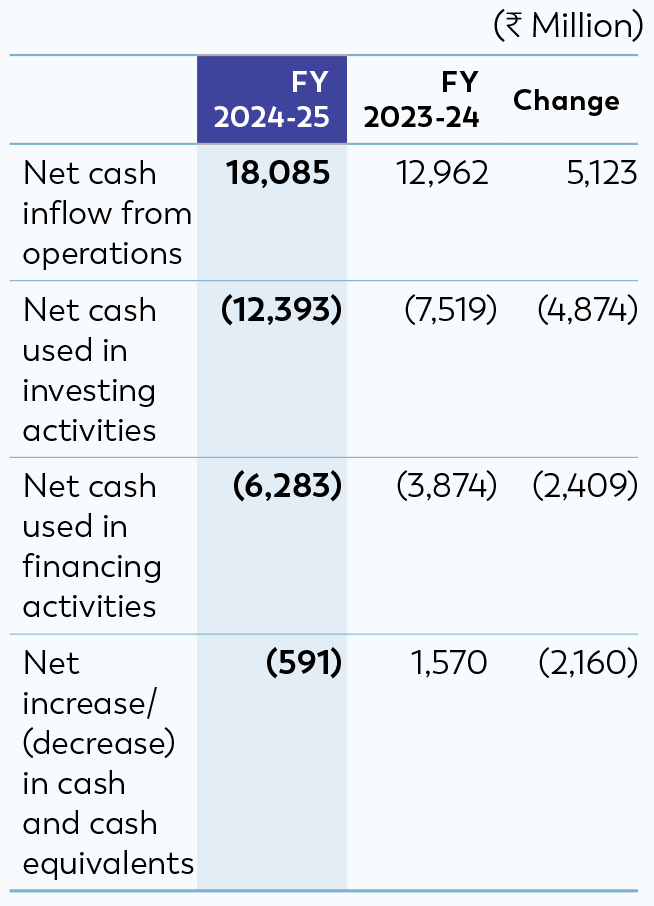
Net Cash Inflow from Operations
Increase in net cash inflow from operations by `5,123 million is mainly on account of
Major cash outflows:
- Increase in taxes paid by `588 million
- Decrease in trade payables and acceptances by `9,164 million
- Decrease in financial, other liabilities and provisions by `1,551 million
Major cash inflows:
- Increase in cash operating profit by `3,721 million
- Decrease in Trade receivables by `1,525 million
- Decrease in inventories by `7,375 million
- Decrease in other and financial assets by `3,805 million
Net Cash used in Investing Activities
Net cash used in investing activities in FY 2024-25 was `12,393 million mainly due to:
- Net outflow/reduction of investments in mutual funds and fixed deposits of `3,029 million
- Purchase of property, plant and equipment (including CWIP) of `9,583 million
Net Cash used in Financing Activities
Net cash used in financing activities in FY 2024-25 was `6,283 million, mainly on account of:
Major cash outflows:
- Payment of dividend of `4,511 million
- Payment of lease liabilities (including upfront payments) of `658 million
- Interest paid of `1,685 million
Major cash inflows:
- Amount received on exercise of stock options of `73 million
- Net proceeds from borrowings of `498 million